Getting to know our passengers

After the June analysis of our departing passengers, when we had interviews with more than 1200 random passengers during the whole June, we came to pretty interesting outcomes.
As one of the fundamentals of route developing, you need to obtain and have in depth knowledge about your own passengers and your own market, so you can create your flight network.
Last similar analysis was performed during October 2015, but our Aviation and Marketing team wanted to have new data based on a summer season, so that cross check with old data can be performed.
One of the main reason to have a new analysis was to confirm our catchment area, to see from where and which part of country(ies) are actually our passengers coming from. Report showed that 73% of our passengers are coming from the Netherlands.
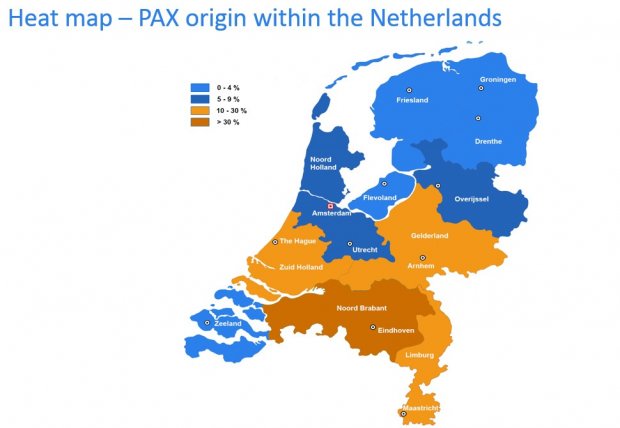
When we created our heat map of Dutch passengers, all our claims about domestic catchment area was just confirmed. Majority of our passengers are coming from our region (North – Brabant 38%) and then regions next to North Brabant, Gelderland with share of 16%, South Holland 13% and Limburg 9%. Interesting fact is that 11% of our passengers are coming from Amsterdam and Utrecht area. This is just a proof that Eindhoven airport has a different catchment area than Amsterdam airport, and that even 11% of our passengers are coming from surrounding area of Amsterdam.
Furthermore, according to report from 2015, only 4% of all our passengers were originally from Belgium, and new report showed significant increase of Belgium passengers with total amount of 11% of passenger share. This was a great feedback to our Belgium campaign from April, because obviously it generated more passengers from Belgium.
Main portion of these Belgium passengers are originating from northern part of Belgium within the Dutch speaking part of the country (63% of Belgium passengers are coming from Antwerp province and 18% from Limburg province).
Another very interested fact was in the habits of our passengers. Outcome for a travel habits showed that 84% of passengers used airport more than once within 12 months and 32% of them had 4 and more flights within last 12 months. Wow ! It seems that we have a frequent passengers here and that is something that we should be proud of and keep it as a great base for a further development of a flight network but also development of services towards passengers.
One of North Brabant and Eindhoven airport growth pillars – “Brainport” - as a top European high tech region has a strong influence to our passenger profile, because we noted that 60% of passengers has a high level of education (Bachelor, Master degree or even higher).
This report will help us to develop a tailor made proposal for the airlines, cause now we have more in depth knowledge about background of our passengers. For sure we will not stop on this report, cause next analysis will is already scheduled for the winter period (November, December), so we can have more knowledge about background and habits of our passengers during the winter period.


