European airlines unit cost analysis: CASK is still king

A scatter plot of European airlines showing cost per available seat kilometre (CASK) against average trip length reveals much about their relative competitive positioning.
Even after many years of convergence ('hybridisation' used to be the buzzword), such analysis highlights ongoing differences between business models and reconfirms a few truisms.
Low cost carriers (LCCs) really do have lower unit costs than full service carriers (FSCs), while ultra-low cost carriers (ULCCs) have even lower unit costs.
Summary
- Plotting CASK vs average trip length clearly divides Europe’s FSCs, LCCs and ULCCs by unit cost, and by network focus.
- Average unit cost levels fell for FSCs, LCCs and ULCCs in the decade to 2023, partly because average trip length increased.
- Trip length-adjusted CASK also fell (on average) between 2013 and 2023, led by FSCs.
- Business models have been converging for a decade and longer, but very clear unit cost and network differences remain between FSCs, LCCs and ULCCs.
Plotting CASK vs average trip length clearly divides Europe's FSCs, LCCs and ULCCs by cost…
A direct comparison of cost per available seat kilometre (CASK), or unit cost, for different airlines is not straightforward as it varies with the average distance flown.
In general, the cost of producing a seat kilometre falls as average trip length increases. Plotting CASK versus average trip length allows the relative cost efficiency of different airlines to be compared visually.
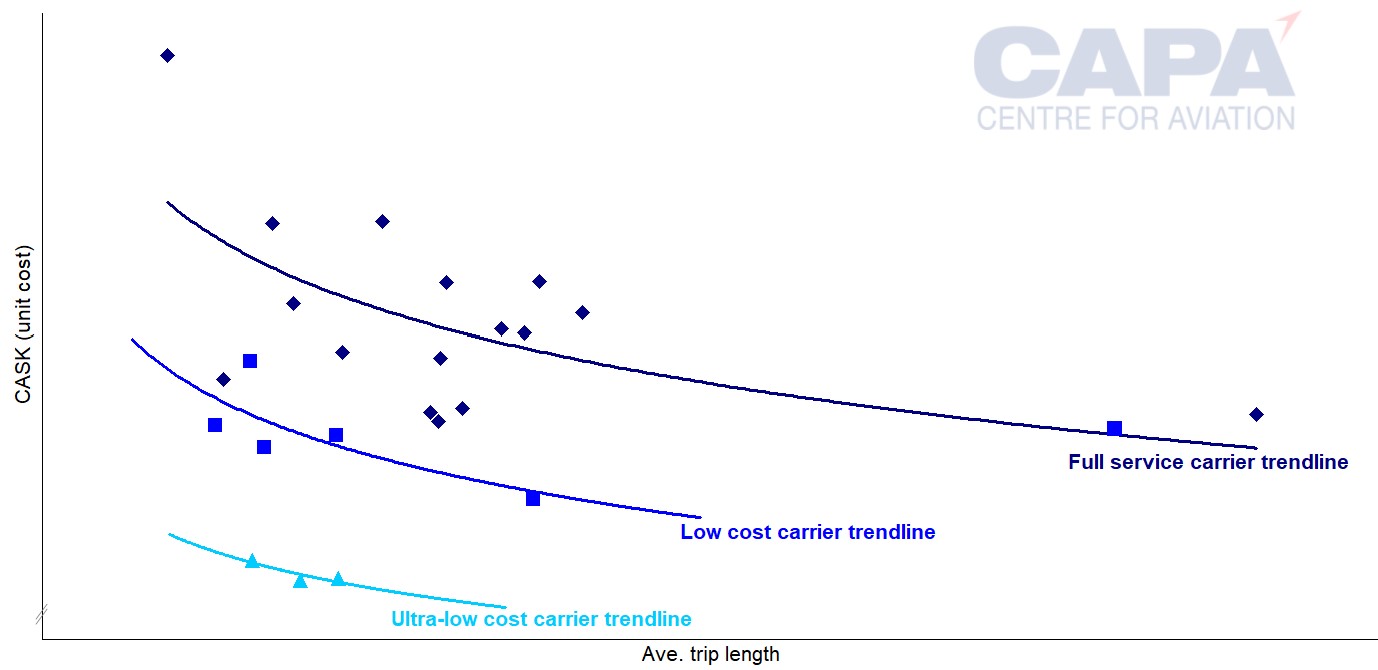
The chart below, using data for 2023, reveals a clear divide between Europe's FSCs, LCCs and ULCCs (note that unit cost is ex fuel CASK, to eliminate the impact of fuel price changes).
There are some cost-efficient FSCs that are close to LCC territory (including Aegean Airlines, Finnair and Turkish Airlines), and one LCC whose unit cost is overlapping with them.
Nevertheless, the majority of FSCs sit in a different cluster to the majority of LCCs on the chart.
The divide between LCCs and ULCCs is even more pronounced, with no overlap between these two groups.
The chart justifies the names given to the different categories of airline business model: for a given average trip length, low cost carriers have a lower CASK than full service carriers, and the ultra-LCCs have the lowest unit costs.
Europe airlines: cost per available seat kilometre (CASK, USc) versus average passenger trip length (km) 2023*

*Nearest financial years to calendar 2023.
Source: CAPA - Centre for Aviation CASK Database, airline reports.
…and by network focus
In addition to unit cost difference, the chart also illustrates the different network focuses of each category.
Most of the LCCs and ULCCs focus on short/medium haul, with average trip lengths typically between 1,000km and 2,000km.
However, both PLAY and Norse Atlantic had average trip lengths above this range in 2023.
PLAY's business focused on connecting destinations in Europe and North America via its Reykjavik hub, since adjusted to focus more on Europe point-to-point.
Norse Atlantic is the only pure long haul low cost operator in Europe, but is still relatively small, and operates a wet lease business in addition to its own network.
There are a few FSCs with average trip lengths in a similar range to those of the typical low cost competitor, but the average for the majority is longer: between 2,000km and 3,500km.
Apart from PLAY and Norse, there are no LCCs/ULCCs with average trip lengths in this range (although they do operate individual routes of these lengths).
This means that the main competition for most FSCs on most of their network is other FSCs (including those from other regions). As the chart demonstrates, there is a wide spread of CASK levels for a given average trip length within the FSC category, giving a competitive advantage to those at the lower end.
On their shorter routes, FSCs are competing with other FSCs in addition to LCCs and ULCCs.
Of course, for almost all FSCs, average trip length is a blend of short/medium haul and long haul routes. There is only one FSC that is a pure long haul operator: namely Virgin Atlantic.
Business models have been converging for a decade and longer
In terms of the services and product features offered by Europe's airlines, the process of business model convergence has blurred the distinctions between full service and what used to be called 'no frills' airlines.
A decade and more ago, low cost carriers started to add features not previously offered by adherents of the pure 'no-frills' approach.
Such features included: primary airports, allocated seating, loyalty programmes, transfer ticketing, codeshares, corporate accounts, selling via travel agents and the GDS, lounges, and different fare classes.
Of course, additional features and services come at a price, and are designed to maximise revenue.
At the same time, in order to compete better with the low cost airlines, FSCs started to unbundle their product. Almost all of them have offered seat-only fares for many years, charging extra for additional features such as checked bags and on-board catering.
Average unit cost levels fell for FSCs, LCCs and ULCCs in the decade to 2023…
This competitive process, driven by market forces, has led to some improvements in cost efficiency.
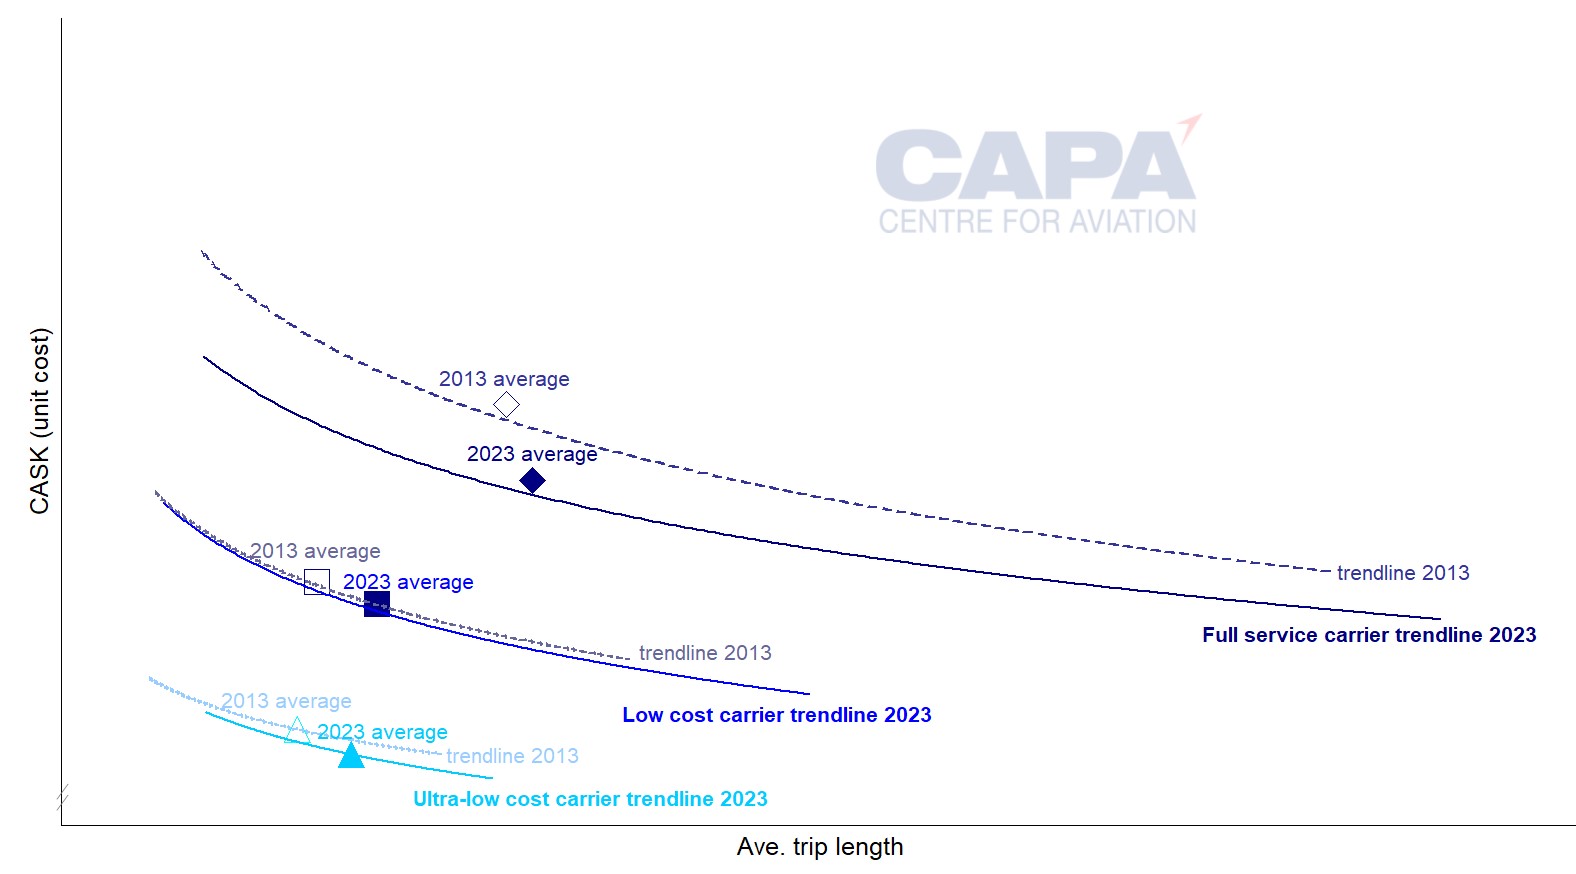
The average ex fuel CASK for all three business model categories was lower in 2023 versus 10 years earlier (based on a simple arithmetic average).
Ex fuel, the average unit cost for the FSCs in the above chart fell by 15% over the period 2013 to 2023.
The average ex fuel CASK fell by 6% for LCCs and by 13% for ULCCs over the same time frame.
…partly because average trip length increased
However, for all three categories, the average of their average trip lengths increased: by 6% for FSCs, by 23% for LCCs, and by 22% for ULCCs.
This should naturally lower CASK without any underlying cost efficiency.
Europe airlines: trendlines of (CASK, USc) versus average passenger trip length (km) 2013 and 2023*

*Nearest financial years to calendar 2013 and 2023.
Note: averages for 2013 and 2023 are simple arithmetic averages of CASK and average trip length for airlines in the underlying plot (excluding Norse Atlantic).
Source: CAPA - Centre for Aviation CASK Database, airline reports.
Trip length-adjusted CASK also fell (on average), but at lower rates…
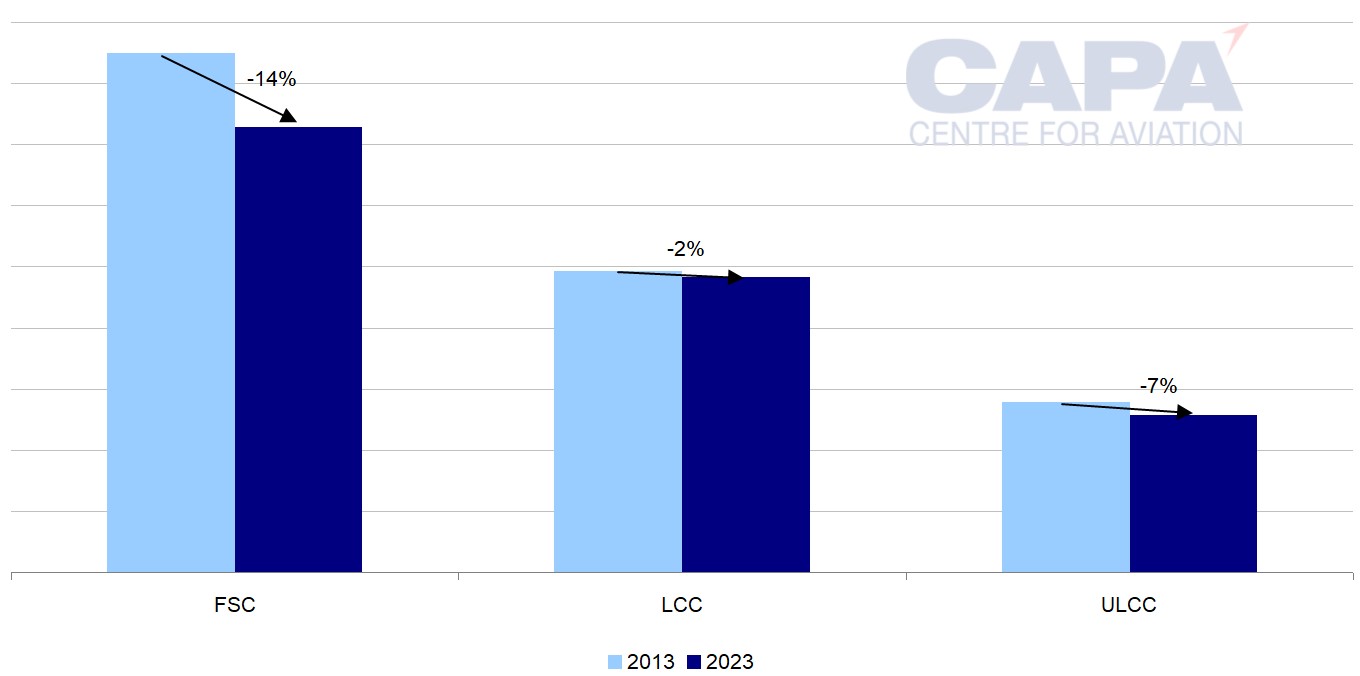
In order to remove the impact of these increases in trip length, it is necessary to adjust CASK to the same average trip length for all three categories, for both 2013 and 2023.
This can be done by choosing a single average trip length - 1,500km sits comfortably within the scope of all three business models - and calculating the associated CASK level that would sit on the (logarithmic) trend line for each category.
The resulting figures still show declines in CASK over the 10 years, but at slightly lower rates: a drop of 14% for FSCs, 2% for LCCs and 7% for ULCCs.
…led by FSCs
From this it is clear that FSC average CASK has fallen by the highest percentage, followed by ULCCs, while LCC average CASK is little changed.
Within the FSC category, the range of CASK has narrowed as a result of airlines at the higher end making the biggest reductions, and this has brought the average down.
Average trip length-adjusted ex fuel cost per ASK (ex fuel CASK), 2013 and 2023*

Adjusted to average trip length of 1500km.
Source: CAPA - Centre for Aviation, airline reports.
But very clear differences remain between the business models
In 2023, and at a notional average trip length of 1,500km, CASK differentials remained significant.
ULCC CASK was 65% below FSC CASK (versus 67% in 2013), and LCC CASK was 34% lower than FSC CASK (versus 42% in 2013).
While the gap between the business models has narrowed a little, there are still clear differences when it comes to CASK and average trip length.
Full service carriers have lowered unit costs since 2013. However, by comparison, low cost carriers and ultra-low cost carriers still justify their names.


