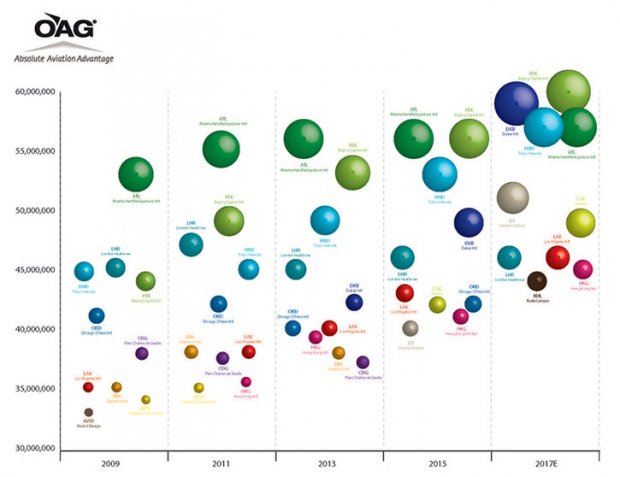
Where will the largest airports be in 2017?

We take a look at recent capacity trends at major airports and project forward to see what the largest airports could be in 2017.
At the end of last month we ran a story on IATA’s 20 year forecast and illustrated the growing focus on China by 2030. In response to an article written by David Rogers in Global Construction Review entitled The Future of Air Transport, which draws on data from various sources (including OAG), we have taken a look at recent capacity trends at major airports and projected forward to see what the largest airports could be in 2017. Many of the predictions about future air travel assume that the hub model will continue to prosper – very much the assumption that the new breed of mega-hub airports are relying on – but it’s quite possible that the airline industry’s business model may change over the next 16 years.
Using the average growth rates for the last three years, we will quite soon see a dramatic change to the make-up of the top 10 airports in the world (by seat capacity). By the end of 2017, Beijing will have surged to the top (and certainly before that point) however that ignores the reality of physical constraints at the current Beijing Capital International Airport which is already bursting at the seams. The new international airport at Daxing which is planned for 2018 cannot come soon enough! A number of the possible top 10 airports in 2017 such as Jakarta, London Heathrow and Hong Kong, have similar well publicised challenges, however cities / metropolises such as Dubai and Istanbul already have new airport facilities being constructed to handle the growth of tomorrow.
Using recent growth rates is a fairly basic measure to assess future trends however current schedules capacity data filed by the airlines for 2015 suggests that this growth is set to continue, and continue moving east. Only five years ago, there were eight European or US airports in the top 10. By 2017 or earlier, there may only be three. At that time, there could be in excess of 120 million seats into and out of Beijing with Dubai close behind, and the top 10 would be providing almost 40% more seats than the top 10 in 2009.
Planning a new facility now for introduction in three to five years in such a dynamic environment is massively challenging and the changing needs of airlines and passengers is difficult to predict. With the IATA forecast suggesting that by 2030 the Chinese air passenger market will exceed the US market, alongside the type of capacity analysis shown in the bubble chart, the growth is coming – how we handle it is a different story.


